
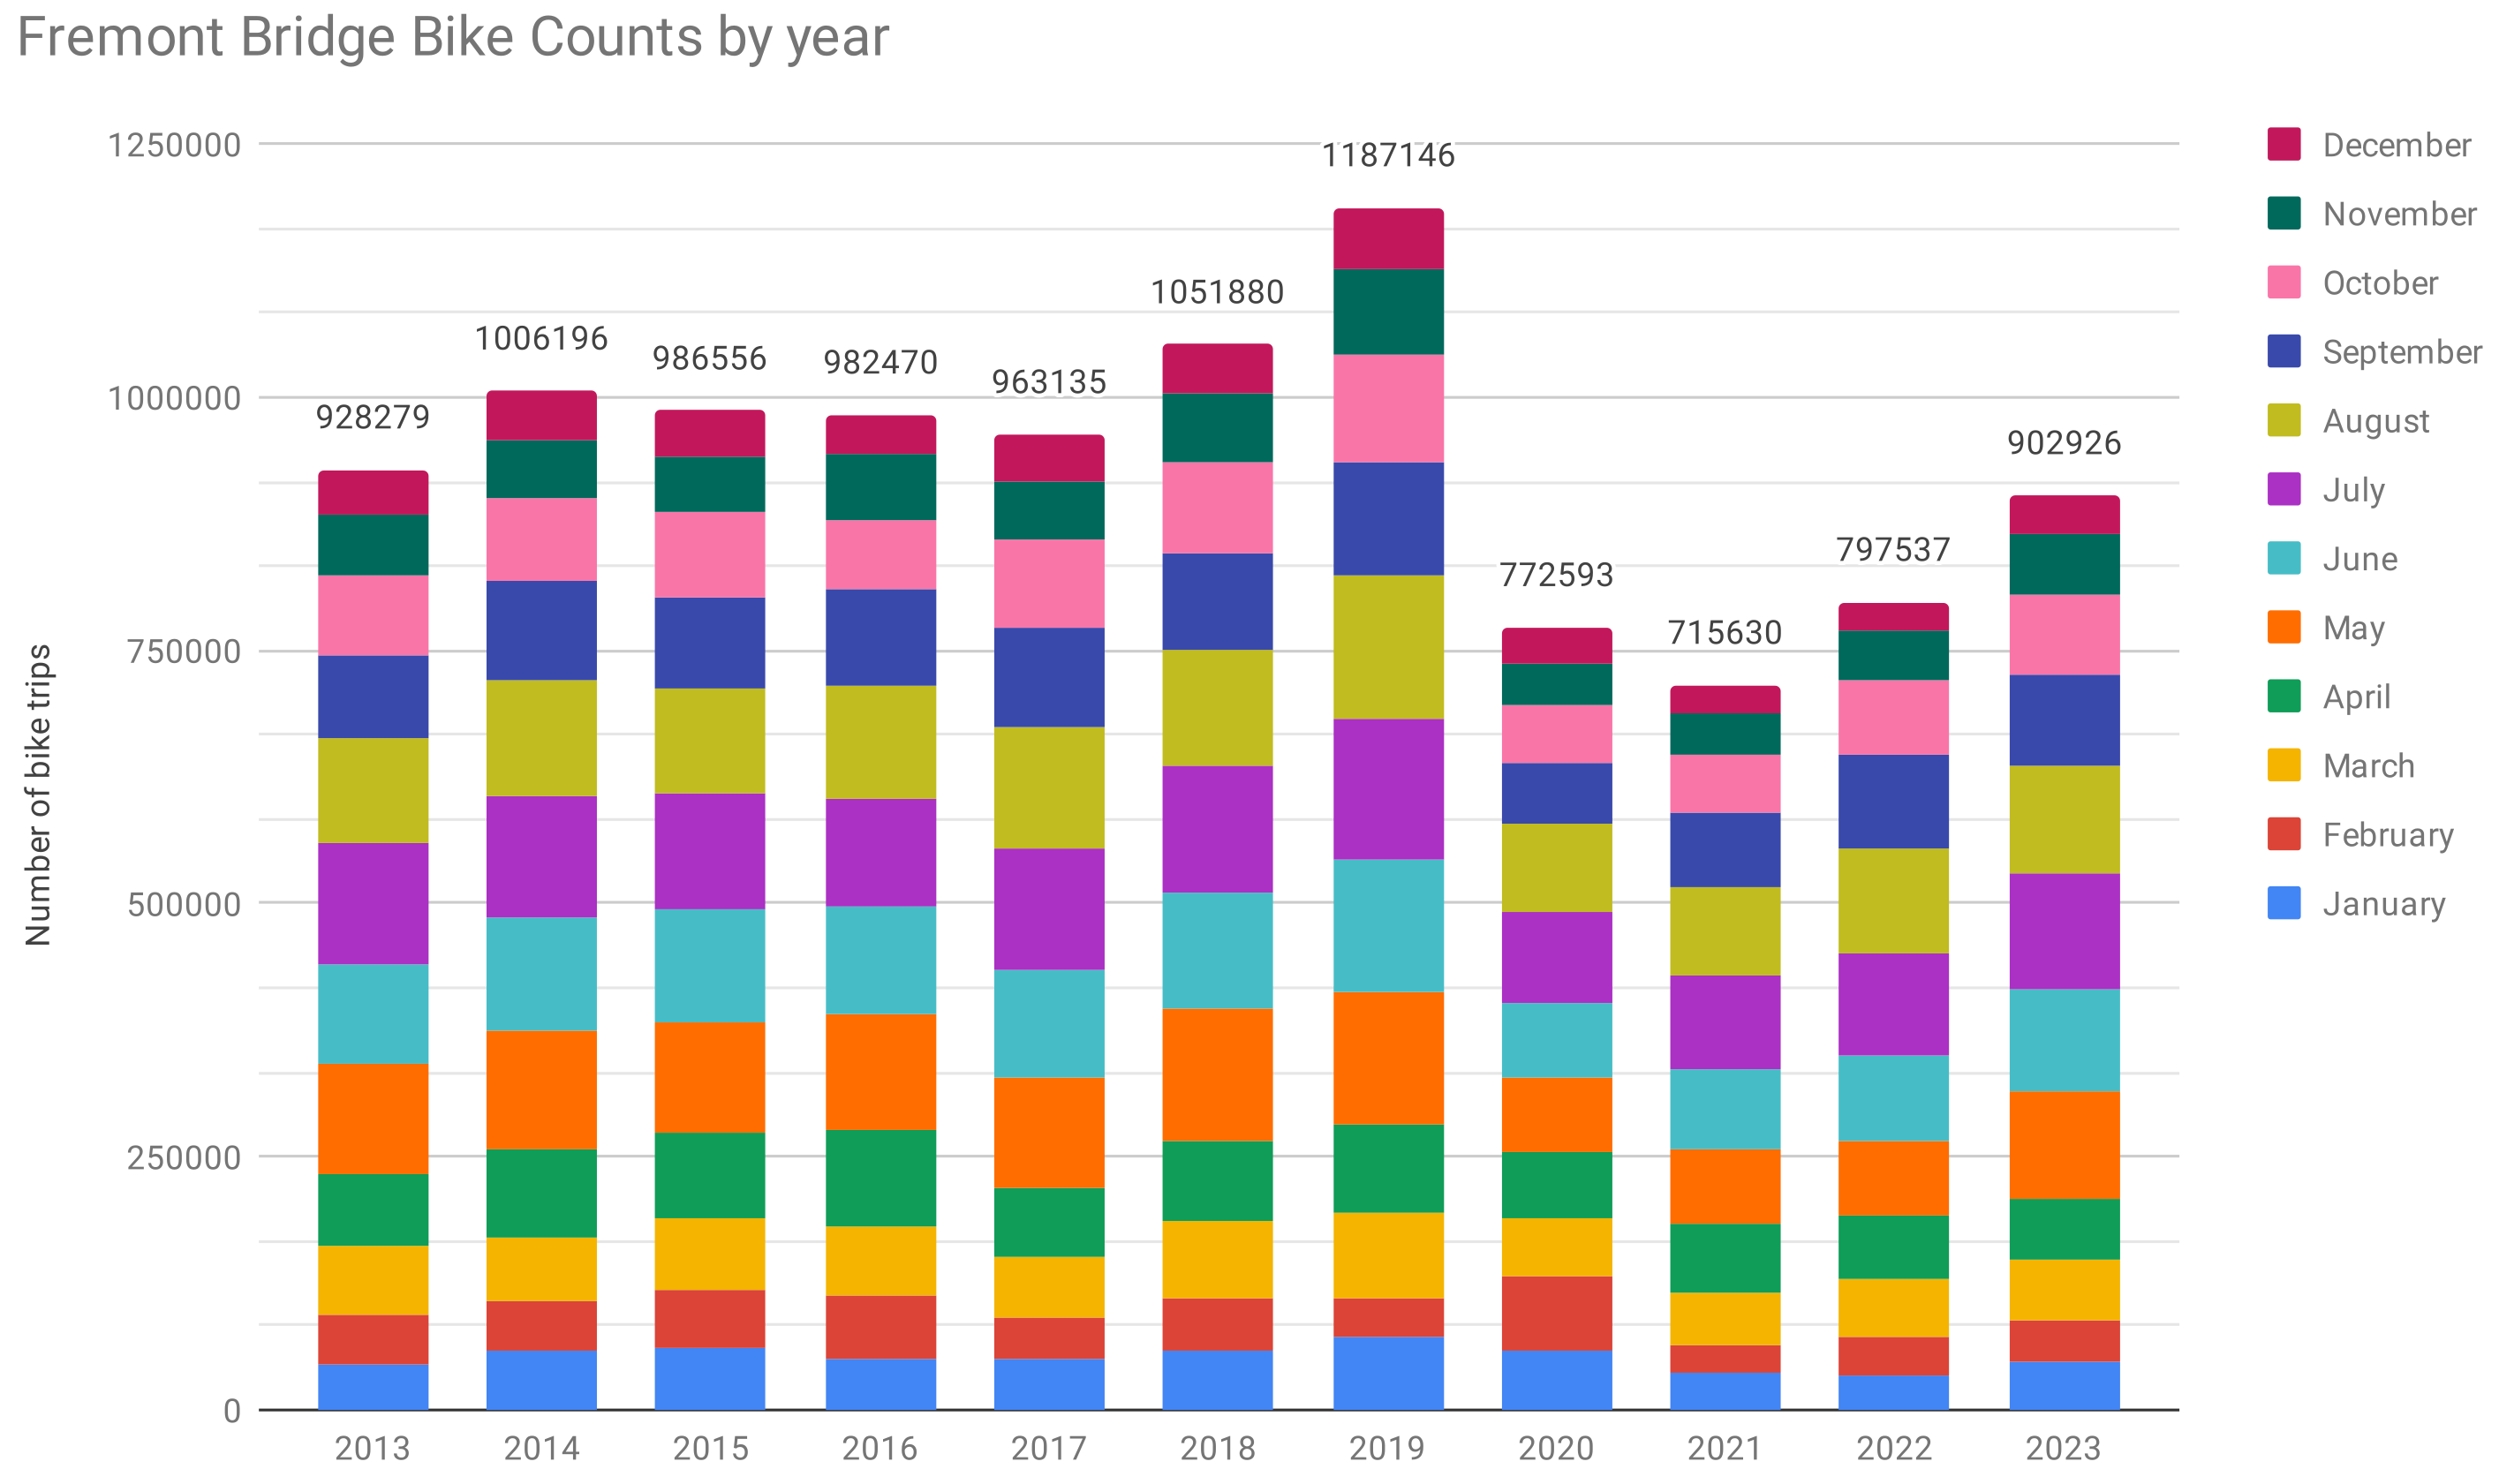
Travel patterns are still out of whack, but the number of bike trips across the Fremont Bridge in 2023 were up more than 13% over 2022, which was itself up more than 11% over 2021. Altogether, the number of people biking across the Ship Canal has almost returned to pre-pandemic levels, with 902,926 counted in 2023. That’s nearly 190,000 more trips than 2021.
That total still lags behind the astounding record set in 2019, when 1,187,146 trips were counted, but it is getting closer in line with the years preceding 2019 when the annual counts flirted with the 1 million mark. The Fremont Bridge is largely a measure of cross-city trips headed between the city center and the north end, but it has typically been our single best point for taking the city’s biking temperature because so many different bike routes all converge at this single point. The counts include both sidewalks, not just the side with the display.
However, the increase in people working from home since the start of the pandemic hit the Fremont Bridge bike counts hard because of its outsized role connecting homes to offices. The numbers are increasing as major employers try to get more people to work in their offices more often, but it remains unknown whether or when the center city workweek will return to the activity levels seen before the pandemic hit. As of 2022, Seattle had work from home rate far higher than the national average (25.4% for the region and 36% for the city versus 15% for the national average). Before the pandemic, the work from home rate was about 6.5%, according to Census data reported by Axios. Census data is released annually in the late summer, so comparable 2023 data is not yet available. It’s not just the office workers themselves who are a factor here, but also all the people working a wide variety of jobs that keep a bustling employment center functional. Service workers typically don’t get to work from home, those jobs simply disappear along with their associated bike trips across the Fremont Bridge.
Data scientists with more number crunching skills than me may be able to tease some more insights out of this data now that we have a few years of pandemic recovery to analyze. I have sloppily collected the Fremont data in this spreadsheet, though you can also pull the raw figures from the data.seattle.gov website. Let us know if you find anything or if you have any questions by commenting below or emailing [email protected]. From what I can tell, it remains difficult to separate out work-from-home patterns from signals about Seattle’s general interest in bicycling using just the Fremont Bridge data. For example, working from home decreased by about 11 percentage points from 2021 to 2022 while Fremont bike counts increased by about 11% during the same time. However, I don’t know if these numbers are directly comparable in this way (we may have reached the limits of my statistics knowledge). What I really want to know is whether people taking trips that could reasonably be served by a Fremont Bridge bike ride are more or less likely to choose to bike than before the pandemic. I suspect we don’t have all the data to answer this question.
This increase in biking across the Fremont Bridge coincides with a big reported increase in bike and scooter share trips, which topped 5 million for the first time ever and were up 28% over 2022. The bike and scooter share increase is likely related to the area’s rebounding transit use, which is of course also related to the decrease in working from home. Before the pandemic, Seattle had made remarkable progress in reducing drive-alone commute trips mostly by increasing walking, biking and transit (though walking and transit saw the biggest increases). So it is promising to see all these signs suggesting the city is getting its transportation progress back on track.
For now, perhaps it is time to restart the race for 1 million Fremont Bridge bike trips. If the trend continues and we see another 10% or higher increase in year-over-year bike trips, then 1 million could be within reach again in 2024.


Comments
3 responses to “Fremont Bridge bike trips were nearly back to pre-pandemic levels in 2023”
It’s time for a real improvement to the connection between the bridge and the Westlake Cycletrack. Especially coming north on wet nights (coming uphill, with headlights from above aimed straight in your face) it’s one of the worst spots for nighttime visibility in a city where nighttime visibility is generally the worst of any I’ve ever been to. In this awful visibility, next to loud roads, we mix pedestrian and bike traffic, that one terribly positioned lighting mast, and bikeshare bikes left directly in everyone’s way. It’s not how one of our most popular bike routes should be.
I would like to see numbers for the Jose Rizal bridge. It is positioned like the Fremont bridge. Many bike routes converge here. Sadly no (working) bike counters in South Seattle at all.
I agree completely. That’s the best bike route pinch point south of downtown (along with the Spokane Street Bridge, which already has one). The other bike counter displays were sponsored I believe, so maybe an employer could put some funds into a Jose Rizal counter with a nice display. SDOT installs counters for data collection purposes, but the displays end up being the more expensive part.