
The good news is that the horrific increase in pedestrian deaths Washington State saw in 2021 did not continue to increase in 2022. But that’s the end of the good news in this story. Preliminary counts in a recent report from the Governors Highway Safety Association show that an estimated 130 pedestrians were killed in Washington State in 2022, a decrease compared to the state’s shocking total of 144 deaths in 2021. However, the 2022 count is still far above the 101 deaths in 2019, and the national trend showed the count continuing in climb in 2022 over 2021.
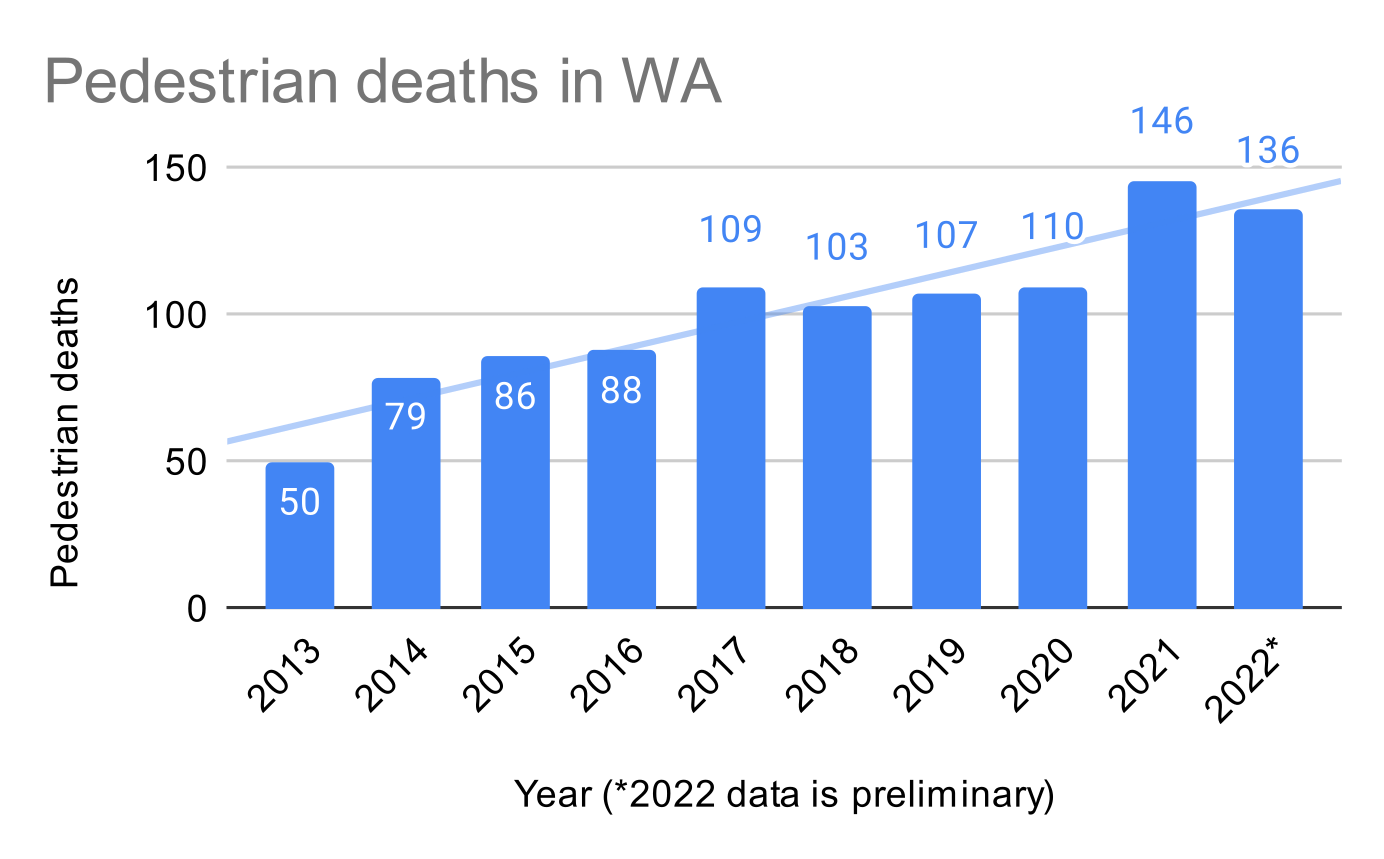
UPDATE 6/27: In response to a reader’s question, I have updated the chart above with additional data from the Washington Traffic Safety Commission, which also has more updated counts compared to the GHSA report. Unfortunately, the WTSC has counted 136 pedestrian deaths in 2022, down from 146 in 2021 but still horrifically far above the 50 deaths in 2013.
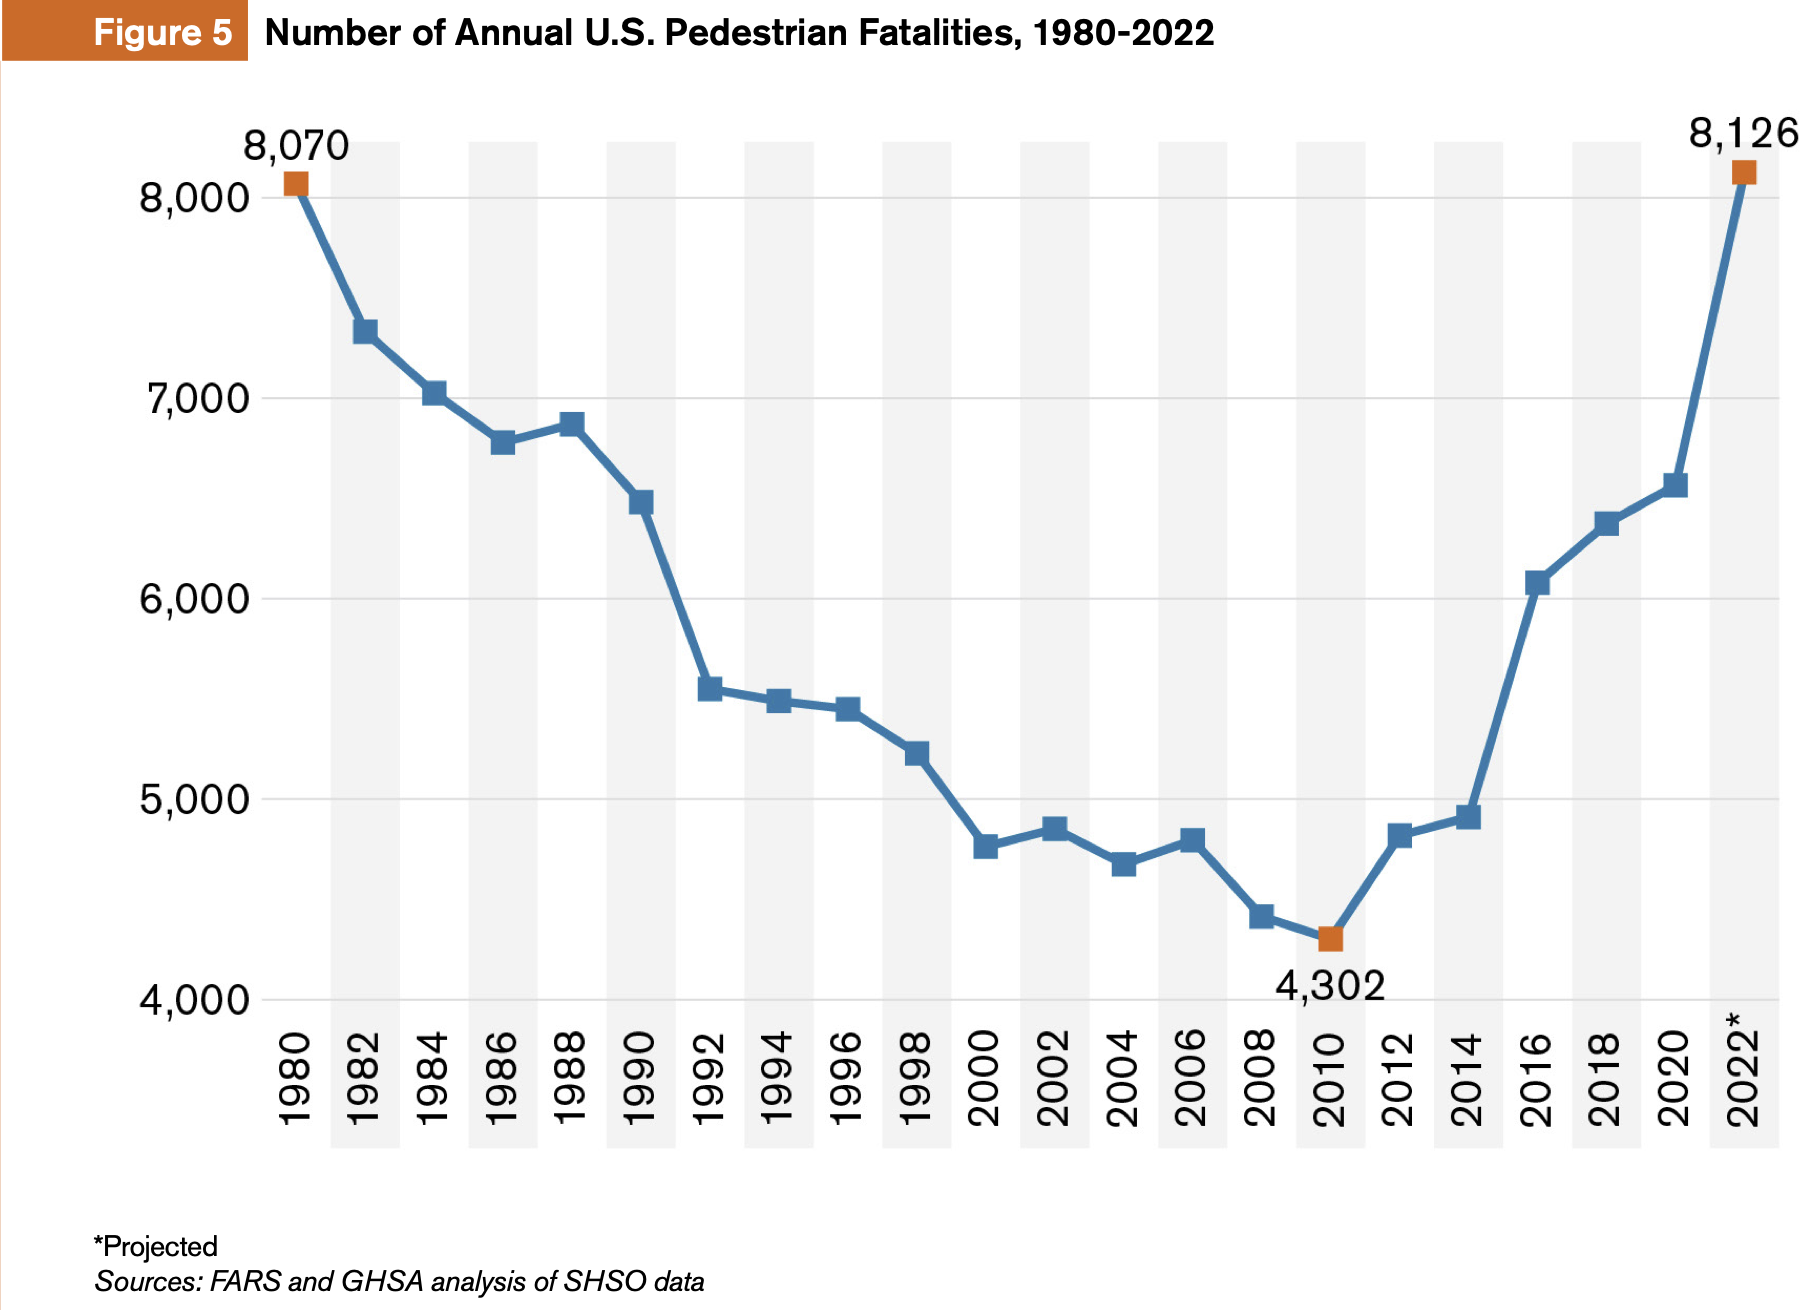
Nationally, pedestrian deaths rose 77% between 2010 and 2021 while all other traffic deaths rose 25%, and the U.S. likely crossed a grim total not seen since 1980: More than 8,000 pedestrians killed in a single year.
The chart should be setting off top level emergency alarms in every transportation department and regulatory office in our nation. Something has changed dramatically since 2010, and no it isn’t iPhones. Most of the world is seeing fewer traffic deaths, and they bought iPhones, too. Dangerous vehicle designs, especially among popular SUVs and pickups, are likely among the biggest factors behind this increase. Vehicle size and weight has increased dramatically, and those increases have come at the expense of people outside of them. “Light trucks,” an official vehicle category that includes everything form minivans to pickups to SUVs including so-called “crossover” SUVs, now make up more than 75% of all cars sold in the U.S. according to Transportation Alternatives in New York City. The average weight of a passenger vehicle has increased from 3,200 pounds in 1980 to 4,200 pounds today. “Supersized vehicles,” as Transportation Alternatives calls them, are 41% more likely to kill a pedestrian that they strike compared to a sedan traveling at the same speed. But this effect is multiplied by the fact that supersized vehicles are less maneuverable and have worse driver visibility than most sedans, making their drivers 3–4 times more likely to hit a pedestrian while turning compared to sedan drivers.
“Between 2014 and 2019, 43% of children killed on New York City streets were struck by SUVs or larger vehicles,” Transportation Alternatives wrote. “Between 2019 and today, that number rose to 77% of children killed. In 2022, a record number of children were killed by traffic violence in New York City, and more than 80% were struck by SUVs or larger vehicles.”
As though these numbers couldn’t get more tragic, many child traffic deaths occur in people’s own driveways because these supersized vehicles are so big people can’t even see their own children playing in front or behind them. People think they need these giant vehicles for safety perhaps because they’re imaging high-speed wrecks where they would rather their vehicle obliterate someone else instead of the opposite, but they are actually making their own driveways more deadly.
This is a problem to horrific and large that it’s easy to feel demoralized and powerless to do anything about it. This is especially true at the local level, where city and county governments have very little power over things like regulating vehicle designs. Transportation Alternatives is pushing New York City to implement significantly higher vehicle registration fees on large vehicles, which is an idea. But the real decisions need to come from Federal automobile regulators or perhaps even a West Coast alliance of California, Washington, Oregon and whoever else wants to join, which represent a large enough buyer base to effectively change automobile designs. Vehicles that block drivers’ abilities to see other road (or driveway) users should simply not be legal.
But perhaps the biggest lesson for local and state transportation agencies is that our world has changed. Any traffic safety assumptions from the 1990s or even 2000s needs to be questioned because they may not apply to a world of mostly “light trucks.” We have traffic safety solutions to slow vehicle speeds and increase crosswalk visibility. These needs to be implemented as widely and as quickly as possible. So many of our streets have these highway-inspired designs that assume drivers can effectively see others, navigate lane merges and stop quickly. These assumptions have always been wrong, but they are especially so in our supersized vehicle reality today. In a report released earlier this year, SDOT found that 80% of Seattle pedestrian deaths occur on streets with two or more lanes in the same direction. We need the entire traffic engineering profession to accept that in an urban environment, people are not and will never be capable of safely handling “double-barrel” traffic lanes. Recognizing that drivers now are more likely to be in heavy, supersized vehicles with poor visibility only makes this point more clear.
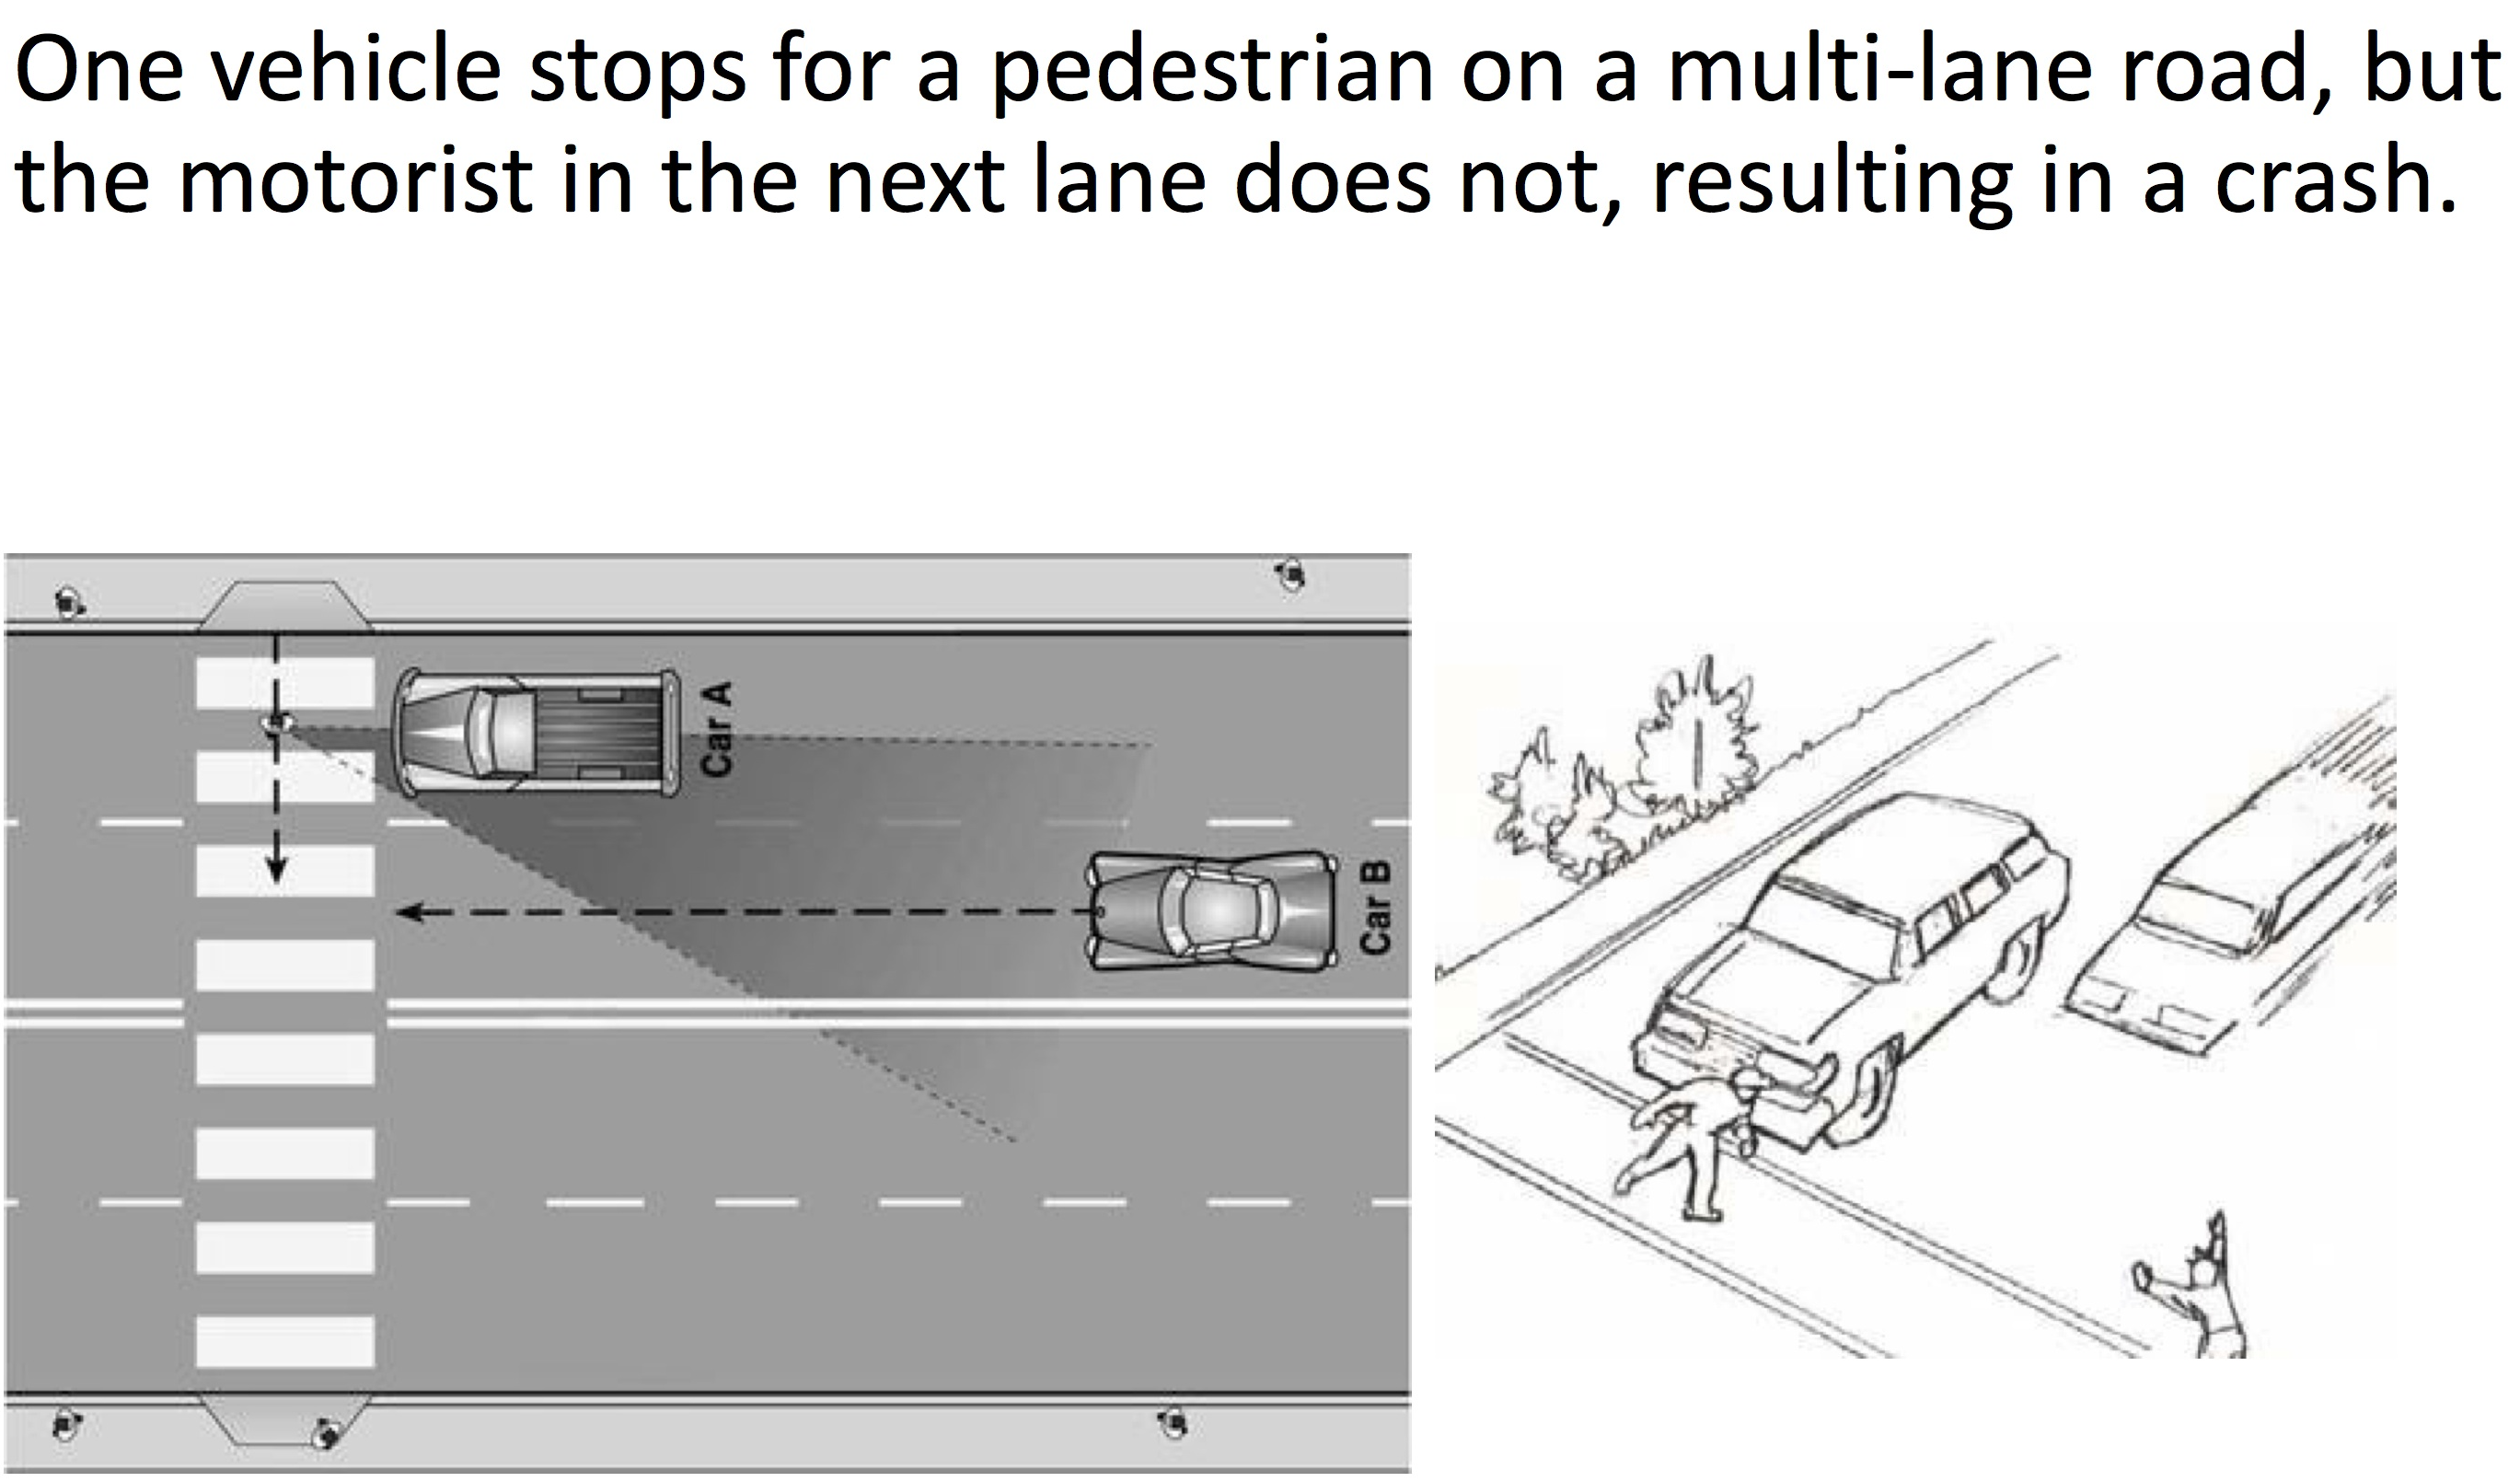
Double-barrel streets have higher speeds because the top speed is set by the fastest driver, not the slowest one. But they also have an unsolvable problem that SDOT has referred to as a “multiple threat.” Basically, one person stops to let a person cross the street, but the person in the adjacent lane keeps going, perhaps because the first car blocked their view of the person crossing. Now, this is clearly the second driver’s fault because you should always stop when the lane next to you is stopped, especially at a crosswalk (Reminder: Nearly every street corner is a legal crosswalk in Washington whether it is marked with lines or not). But the problem is so prevalent that it must be considered a fault in the design rather than user error alone.
The solution is simply stated: Every crosswalk, marked or unmarked, should be safe to use. If it is not safe, then urgent action is required to make it safe. Dangerous crosswalks exist in every neighborhood. The easiest way to improve the safety of many crosswalks all at once is to simplify street operations through one of many safe streets designs. Most often, this means one lane in each direction with turn lanes added where needed and viable. Seattle has been doing this since the 1970s on streets like N 45th Street in Wallingford. Even Pike Place was once a set of double barrel lanes. Often, the fix can be completed with little more than some paint and political will. And we have plenty of paint.


Comments
3 responses to “WA pedestrian deaths were down in 2022, but still far above pre-pandemic levels – UPDATED”
Deaths of drivers of motor vehicles also went up dramatically (from 202 to 366) over the same 10-year time period. But strikingly while a lot of the driver deaths involved alcohol, drugs or speeding, very few of the pedestrian deaths did. That really fits with the idea of the changes in vehicle design. And also suggests that it could be fixed.
We know that the real culprit in these deaths and injuries is SPEED. Lower speed collisions cause far fewer deaths so it makes sense to have lower speed for vehicles when pedestrians are present or likely to be present. We also know that posted speed limits and attempts to enforce them are nearly futile in controlling vehicle speed since “speeder’s gonna speed” is the norm. We need better roads that force drivers to slow down because what we have been doing or 100+ years isn’t working.
I have to wonder whether a rise in suburban and rural poverty and homelessness has contributed to these increases. I think the time range sorta lines up (post-2008 recession leading into housing crisis), and I know people in these categories suffer disproportionately from traffic violence, but I don’t know whether the numbers add up to enough to contribute a lot to an overall chart like this. Even if those trends don’t bend this chart it’s certainly a problem for those people that, like a lot of what we’re dealing with right now, demands answers that don’t just look like turning back the clock to 2010. Suburbs with more walkable areas that are less car-saturated. More humane design that keeps car speeds down and gives usable crossing opportunities, even on large arterials. Pedestrian connections that let people avoid the highest-traffic roads more. And a big response to the housing crisis, including patient support and real options for people that have got stuck living outside during it.