
The city of Seattle just released a new report on our citywide carbon footprint. The info in the report is slightly out-of-date, as it’s a snapshot of how we did in 2018, but is the most comprehensive picture we have of how the city is meeting, or rather failing to meet, its carbon reduction goals.
The report includes one significant piece of info that should be encouraging to transportation advocates: the number of miles of vehicle travel for each Seattle resident sunk to its lowest level in decades in 2018. Every single Seattle resident’s share of the miles travelled on city streets was just over 6,000 miles after a likely peak of 7,400 in 2005. This is clearly a result of transportation policy decisions, light rail and the success of the Seattle Transit Benefit District central among them, that drove drive-alone commute rates to record lows.
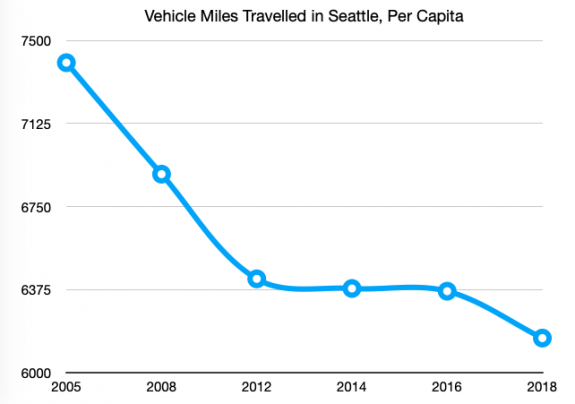
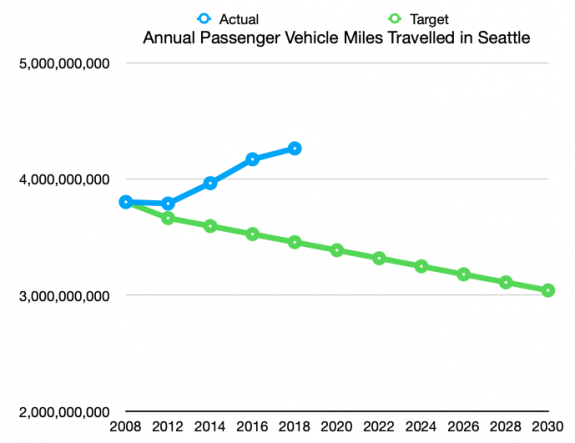
Now for the bad news: due to Seattle’s population increasing, total VMT in Seattle is still continuing to go up even as everyone’s individual share is going down. Per capita miles travelled has gone down 11% since 2008 but overall VMT is up 12%.
Seattle’s goal for miles travelled in the 2013 Climate Action Plan is a 20% drop in overall passenger VMT (separate from freight miles travelled) by 2030. In order to meet the 2030 target, there would need to be a drop of more than 200 million miles per year until 2030.
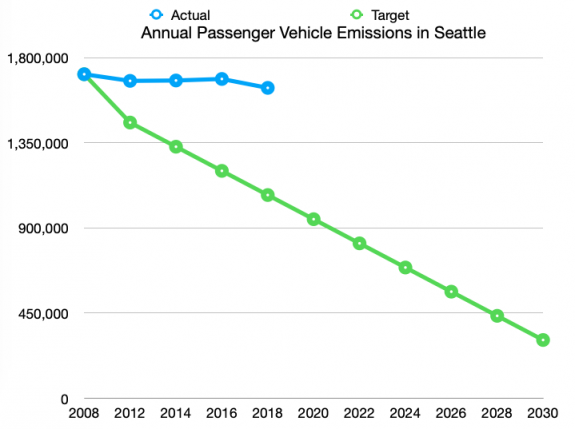
The picture for overall vehicle emissions, the direct impact on the climate, is not much better, though at least there we’re not headed in the wrong direction. Thanks to more fuel efficient vehicles on our streets than in 2008, annual emissions from passenger vehicles were down a hair more than 4% in a decade. 2013’s goal for those emissions is an 82% drop by 2030, a very heavy lift. Currently transportation emissions make up 60% of the city’s overall carbon emissions, and letting gains in fuel efficiency do the work to decarbonize our transportation sector is failing.
The release of the 2018 carbon inventory was orchestrated to come out with a policy proposal from Mayor Durkan to update the city’s energy code to prohibit natural gas in certain new construction for the purposes of space and most water heating. This proposal is even a watered-down version of a bill that Mike O’Brien proposed last year, sure, but the Mayor pairing a concrete policy proposal on building emissions underscores that a hallmark of her administration has been pretending that transportation emissions aren’t something we can do much about. There isn’t a city plan to decarbonize our transportation system.
The city goal remains to reduce VMT from 2008 levels by twenty percent in a decade. And yet at the transportation project level, we are assuming that traffic volumes will continue to increase, which all but assumes that they will. The Ballard bridge’s replacement study, for example, assumed more vehicles on the Ballard bridge in 2040 than has ever used that bridge during its busiest hours going back to 1990. The Magnolia bridge’s replacement study assumes increases as high at 45% on 15th Ave W in Interbay by 2035.
The “action” section of the Office of Sustainability & Environment’s emissions report only includes two strategies to reduce transportation emissions: transportation pricing (which the mayor has made no visible progress on in three years), and transportation electrification: nothing about how we allocate the majority of our city streets, and how we prioritize the funding for the projects that improve those streets to make it easier to travel on them in something that isn’t a personal car. Nothing about how the master plans that the city invests so much time in to improve transit, cycling, pedestrian, and freight infrastructure influence climate goals.
Vancouver, B.C. recently passed a climate emergency action plan, with a very substantive transportation section, that outlines the steps that city is taking to meet its goals. It’s time for Seattle to follow Vancouver’s lead and update the 2013 climate action plan to actually meet the moment we’re in.


Comments
5 responses to “Seattleites Driving Fewer Miles Than Ever, City Report Suggests”
Really curious to see the 2019-2020 data on these graphs. Current VMT data can form a feedback loop with current planning, seems like a blindspot in the planning process.
I think there are two issues, here, which really should be separated. One is congestion and road sharing. The other is CO2 emissions.
Clearly the latter can be accommodated by shifting to EVs. So, I don’t think it’s too meaningful to compare miles driven to target miles with respect to emissions.
But EVs still cause congestion.
My theory is a car is always more convenient and it’s use will rise to the point where congestion takes away that advantage. In other words, it’s pretty much impossible to eliminate congestion.
What we can do, however, is to continue to provide alternatives. Again, this won’t reduce congestion but it will allow more people and goods to move around on the same streets.
This means that the toll revenue projections are way, way off and now the DOT has no idea how they are going to cover the costs associated with the redo of 99 and 520. Man, I never saw that coming. I know that we could not have predicted the covid situation but is anyone aware of a situation in which they underestimated toll revenue? Its a good thing we spent all that money on the 99 tunnel instead of light rail into west seattle…
What really matters here is the per-capita numbers, not the absolute numbers. Of course, a city with more people will, all other things equal, emit more carbon than a city with fewer people. But, as long as the new carbon on Seattle’s balance sheet replaces carbon elsewhere from wherever the people moved from, it not really a net contribution to global warming. This is why it’s important to look at the per-capita numbers.
Great point. Per capital VMT and emissions metrics are the key. If we simply focused on total emissions for the city, the best strategy would be to shrink the city limits or stop building houses.