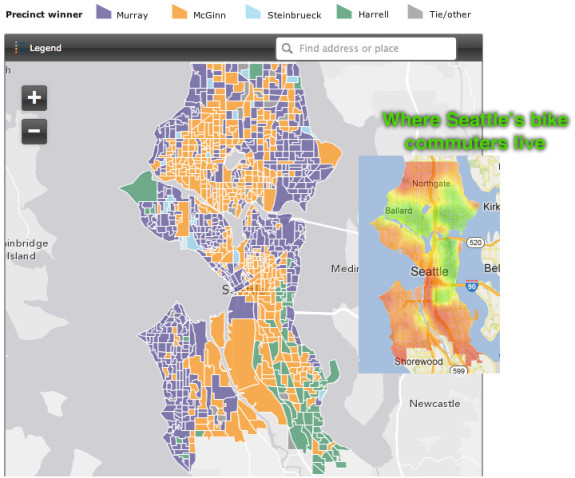
The Seattle Times released an interactive map this week visualizing Seattle’s mayoral primary election precinct-by-precinct. So I thought, How do the results compare to bike commute rates?
As you can see above, there is a correlation between neighborhoods with high bike commute rates (the darkest green sections are nine percent or higher) and votes for Mike McGinn. In no way is this meant to suggest that bikes are responsible for McGinn’s votes. But there’s at least a shared zeitgeist between McGinn and many neighborhoods where biking is a popular part of daily life.
But there are some clear deviations from that theme, and it’s clear that McGinn’s support reaches far beyond the people biking to work every day (this might seem obvious to most people, but not some shock jocks, columnists and comment trolls).
Notably, Seattle’s bikiest area leaned toward Ed Murray. McGinn won the bikey U District fairly strongly, but he barely squeaked out a win in the North University/Ravenna neighborhood that is home to the city’s highest bike commute rate. Areas of Northeast Seattle with very high bike commute rates — like Bryant, Laurelhurst and Wedgwood — leaned toward Murray. Murray also won his home turf in very bikey North Capitol Hill and Montlake.
Perhaps it is partly due to McGinn’s home field advantage in North/Northwest Seattle, but his reach there went much further than the northern Ballard/Greenwood bike commute cutoff around 90th Street, north of which bike commute rates drop dramatically.
McGinn’s support also stretches far beyond bikes in South Seattle. In fact, a cursory look at the election map suggests one path to victory lies in less-bikey parts of Beacon Hill and Rainier Valley, where he has very strong support that in no way correlates with bike commute rates. In most Beacon Hill/Rainier Valley districts that Bruce Harrell won, McGinn trounced Murray. So if McGinn can capture the majority of those Harrell votes, he could be looking very good in the general election.
Both McGinn and Murray have expressed strong support for dense, walkable, bikeable and transit-oriented policies. But McGinn seems to have made a more convincing case to the densest and most bike-friendly areas of the city. Likewise, Seattle Bike Blog endorsed McGinn in the mayoral race.
Murray’s support is largely in wealthy (McGinn won few waterfront precincts) or lower-density (and more car-oriented) neighborhoods, which is probably not exactly what he expected or would have liked. Will Peter Steinbrueck’s supporters default to Murray, or will Murray need to make some backwards, anti-density comments to get that support? I imagine it’s an awkward position for him.
So what role will biking play in the mayoral election? It’s unclear. Barring any missteps from Murray, perhaps the most important role of bicycling has already been completed. After all, both candidates agree that bike safety and access is important. It would seem rather poor strategy for either candidate to deviate from that point unless Murray really does want to abandon his central Seattle votes. Bicycle support can help boost McGinn’s Central and North Seattle bases, but I would wager that other issues will ultimately decide the race in areas like Rainier Valley with a lot of votes up in the air.







Comments
12 responses to “Comparing bike commute rates to the mayoral primary results”
Fun Story- It would be great to see a question on bicycling in the Exit Polling for the General Election- there might be something there? I don’t imagine there are too many cities in America where the bicyclist lobby seriously factors in the Mayor’s race. It’s a testament to all of the great work from the bike clubs and organizations like the SeattleBikeBlog. Thanks Tom,
While not exactly an exit poll, Cascade conducted this recent phone poll of likely Seattle voters: http://www.seattlebikeblog.com/2013/01/23/survey-cycling-is-extremely-popular-in-seattle/
It’s interesting to me how many people think that bicycle infrastructure is a McGinn thing. The original bike master plan pre-dates the McGinn administration, and the argument can be made that Greg Nickels had more of a direct impact on the growth of cycling infrastructure than Mike McGinn. McGinn definitely keeps it in the public eye, though. I’ve been in more than a couple community meetings where anti-bike people fervently believe that all this progress for bikes is going to VANISH ‘when McGinn gets kicked to the curb’ in November. I think those people are in for a surprise, regardless of what happens in November. While I have my issues with the McGinn administration, bikes aren’t one of them. And NONE of my issues with McGinn is worth making Seattle a ward of the state by electing Ed Murray.
The area north of the U District has an interesting mix of people as regards cycling. It’s home to a lot of UW students of various stripes that bike at fairly high rates but, in aggregate, aren’t all that invested (in property or mortgages) in Seattle’s local politics (because they call some other place home or are likely to move soon) and may not be likely to vote in primaries. It’s also home to a bunch of people that show up at community meetings and call bike infrastructure a “dream killer” — these people definitely vote in primaries.
Transportation cycling is a minority activity right now to such an extent that the difference between middling and high relative bike commuting rates can’t even be expected to predict general attitudes toward cycling, let alone electoral results. In Fremont, Greenwood, Ballard, the CD, and Cap Hill fewer residents bike to work than in Ravenna, but the 93% of residents that don’t bike are more likely to be young, more likely to be renters, and because these places aren’t especially convenient to I-5 or 520, are less likely to work in the suburbs (which means they’re less likely to think freeway congestion is a big problem and more likely to think that freeway impacts are a big problem), compared to the 90% of Ravenna residents that don’t bike.
I’m not sure how many people really think the primary was a referendum on biking anyway. For a lot of people (including seemingly Murray) it was a referendum on how McGinn handled the DBT and how he works with other people across various governments and agencies. It was a referendum on whether his freeway opposition is too strident — note McGinn’s strength in the 99 corridor and other strong transit corridors (he got smacked in West Seattle, which is likely to have anti-incumbent tendencies forever because of its inevitable dissatisfaction with its impossible transportation situation, but within West Seattle his best performance was along the Rapid Ride and Route 120) and his weakness (and Murray’s strength) near I-5 and 520; I doubt those things will change no matter what’s said between now and the general. Harrell picked up a lot of primary votes in poorer areas campaigning on other issues (shocker — Mercer and 99 and SLU aren’t relevant to everyone!).
Oh, I absolutely didn’t mean to imply the primary was a referendum on biking. It wasn’t at all. Nearly every candidate talked about the importance of safe streets, bike access, etc. Harrell was the front runner most willing to voice concerns, but he was hardly anti-bike.
I think that there wasn’t a frothing candidate angry about some lost parking and threatening to tear out bike lanes (seriously, this happens in other big North American cities, and they sometimes win) is testament to how strong the city feels about biking.
I was merely testing the whole McSchwinn idea. Turns out: McGinn appeals to lots of other people for lots of other reasons, too! But there is something (or a combo of many things) linking bike rates and a likelihood of voting for McGinn.
I’m a little curious about the data that drives the cycle commuting map. I know that saying it sounds like I’m trying to shoot it down and I really don’t mean to come off that way. (so sorry…) But there appears to be a semi hotspot of cycle commuting around Kellogg Island – on both sides of the Duwamish upstream from Harbor Island, same with the residential pocket north of Bernie Whitebear Wy – across the Lake Washington Ship Canal from Ray’s Boathouse – which I just have a hard time believing.
I am almost certain that it comes from Census data, which is broken down to at least census-tract-by-cencus-tract level. So Kellogg Island is probably in the same census tract as some homes along the Duwamish Trail, which have an impressive bike commute rate.
thanks – your replies are always quick and informative.
I like to think that Kellogg Island’s bike commute rate is really high, though :-)
Interesting post, but one small quibble: If you look at the percentage of people who bike: (http://blogs.seattletimes.com/fyi-guy/2013/02/22/is-your-neighborhood-one-of-seattles-cycling-hot-spots/), the highest value is 9.46% and average values for, say, Ballard hover around 5%. Categorizing that as “neighborhoods where biking is a popular part of daily life” seems a bit of a stretch.
I also agree with Shawn who questions why bicycle infrastructure built in the last 3 years should be attributed to McGinn. Can anybody show with numbers that bicycle infrastructure has been built at an increased rate under McGinn? My sense is that the rate has remained roughly the same and will likely continue regardless of who is mayor.
Take those numbers with a grain of salt. They are the lowest possible estimate for bicycle use.
The Census survey asks people via phone which mode of transportation they used *most* for commuting in the past week. So people who bike to transit are likely counted as transit, people who bike one or two days are likely counted by their other mode, etc.
And, of course, a huge number of people bike to non-commute purposes. People bike to the grocery store, the park, the bar or just for fun, yet they are not factored into these figures. So if 5 percent of Ballard workers use bikes as their primary commute mode, the rate of actual bike use among Ballard residents is WAY higher. How much higher? It’s hard to measure. But this Cascade survey of Seattle voters suggests that just under half of Seattle voters bike at least once a month: http://www.seattlebikeblog.com/2013/01/23/survey-cycling-is-extremely-popular-in-seattle/
So, yes, I’d say that biking is a part of daily life in Ballard. And I wouldn’t shake a stick at the fact that over 9 percent of people in Ravenna bike to work essentially every day. That’s huge! And the number of people biking in Ravenna is way higher.
I *want* the numbers to be high just as much as you, but I don’t kid myself into thinking that way more than 5% of Ballardites bike to work or errands most of the time. It’s not that hard to measure — go to the destinations you mention (grocery store, bar, park), count the cars and count the bikes and then divide. I’m sure that some destinations on some sunny days reach the 10% mark, but not regularly.